")


Candlestick charts are one of the most powerful tools in technical analysis, helping traders visualize price movements and predict market trends. Whether you’re trading forex, crypto, or stocks, understanding candlestick patterns can significantly improve your decision-making. This guide breaks down how to read candlestick patterns, their meanings, and how to use them in real trading.
What Is a Candlestick Chart?
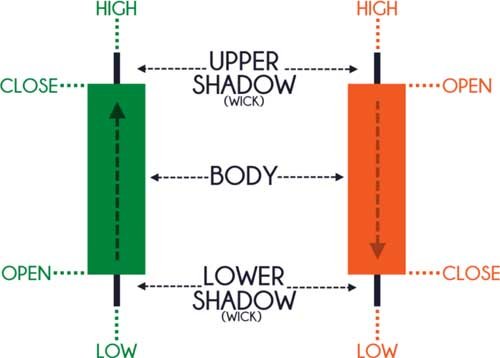
A candlestick chart represents price action over a specific time period. Each “candle” shows four key data points:
Open: The price when the period began
Close: The price when the period ended
High: The highest price reached
Low: The lowest price reached
If the candle body is green (or white), it means the price closed higher than it opened (bullish).
If it’s red (or black), the price closed lower than it opened (bearish).
Structure of a Candlestick
Each candlestick has three parts:
Body: The area between open and close prices.
Wicks (or Shadows): The thin lines above and below the body, showing high and low prices.
Color: Indicates whether buyers or sellers dominated.
Example:
A long body means strong momentum.
A short body shows indecision.
Long wicks suggest rejection of higher or lower prices.
Common Candlestick Patterns
Let’s explore the most recognized patterns traders use daily.
1. Doji
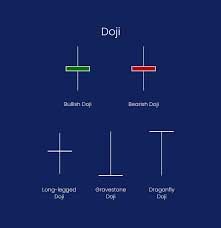
Meaning: Market indecision
A Doji forms when the open and close prices are nearly equal. It indicates that buyers and sellers are evenly matched, often signaling a potential trend reversal.
Long-legged Doji: Big indecision
Gravestone Doji: Possible bearish reversal
Dragonfly Doji: Possible bullish reversal
2. Hammer
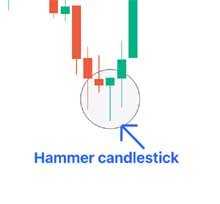
Meaning: Bullish reversal
The Hammer appears after a downtrend and has a small body with a long lower wick. It suggests that sellers pushed the price down, but buyers regained control before closing.
Tip: Confirmation from the next bullish candle increases reliability.
3. Shooting Star
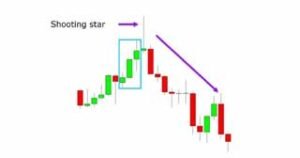
Meaning: Bearish reversal
This is the opposite of the Hammer. It appears after an uptrend with a small body and a long upper wick. It indicates that buyers drove the price up but lost control to sellers.
4. Engulfing Pattern
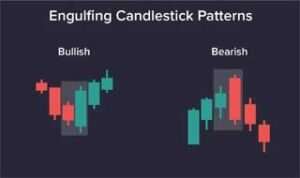
Meaning: Strong reversal signal
Bullish Engulfing: A large green candle completely engulfs the previous red candle, signaling upward momentum.
Bearish Engulfing: A large red candle engulfs the previous green one, showing downward pressure.
5. Morning Star
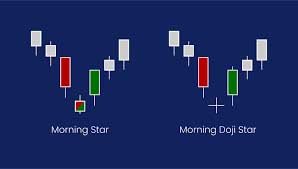
Meaning: Bullish reversal
This three-candle pattern forms after a downtrend:
Long bearish candle
Small indecision candle (Doji or small body)
Strong bullish candle confirming reversal
6. Evening Star
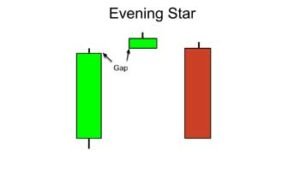
Meaning: Bearish reversal
The opposite of the Morning Star, appearing after an uptrend:
Long bullish candle
Small indecision candle
Large bearish candle
7. Spinning Top
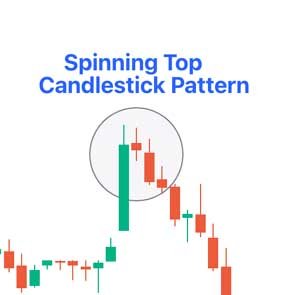
Meaning: Market uncertainty
A candle with a small body and long wicks on both sides, signaling a pause or possible change in trend direction.
How to Use Candlestick Patterns in Trading
Candlestick patterns should not be used in isolation. Combine them with:
Support and resistance levels
Trendlines and moving averages
Volume indicators
Fibonacci retracement zones
Example Strategy:
If a Hammer forms at a key support level with increasing volume — it’s a strong bullish signal.
Common Mistakes to Avoid
Trading patterns without confirmation
Ignoring market context (trend direction, news events)
Using candlesticks on low-volume or low-liquidity assets
Final Thoughts
Reading candlestick patterns is a skill that develops with experience. Start by identifying simple patterns like Hammers, Dojis, and Engulfing candles, then apply them within broader market analysis.
With practice, candlesticks can reveal the psychology behind price movements, helping you anticipate market shifts before they happen.