")


In today’s volatile markets, traders rely heavily on technical indicators to forecast price movements and identify entry or exit points. Among the most powerful tools are the RSI (Relative Strength Index), MACD (Moving Average Convergence Divergence), and Bollinger Bands.
Each provides unique insights into market momentum, strength, and volatility — and when combined, they can form a highly effective forecasting strategy.
Let’s break down how to use these three indicators to predict market trends more accurately in 2025.
1. Understanding RSI (Relative Strength Index)
What It Measures:
The RSI measures the speed and magnitude of recent price changes, helping traders determine whether an asset is overbought or oversold.
-
Formula: RSI = 100 – [100 / (1 + RS)]
(RS = average gain / average loss over a specific period, usually 14 days)
Key Levels:
-
Above 70 = Overbought → Possible price correction
-
Below 30 = Oversold → Possible upward reversal
How to Use RSI for Forecasting:
-
Trend Confirmation: In an uptrend, RSI tends to stay above 40; in a downtrend, it stays below 60.
-
Divergence: When price makes a new high but RSI doesn’t, it signals weakening momentum — a potential reversal.
-
Entry Tip: Look for RSI bouncing from the 30–40 zone in an uptrend, or rejecting 60–70 in a downtrend.
Example:
If Bitcoin’s RSI falls below 30 and then crosses back above, it can indicate an upcoming bullish move.
2. Understanding MACD (Moving Average Convergence Divergence)
What It Measures:
MACD tracks momentum changes by comparing two moving averages — typically the 12-day EMA (fast line) and the 26-day EMA (slow line).
-
MACD Line: 12 EMA – 26 EMA
-
Signal Line: 9 EMA of MACD Line
-
Histogram: The difference between MACD and Signal Line
How to Use MACD for Forecasting:
-
Bullish Crossover: When MACD crosses above the signal line → potential upward momentum.
-
Bearish Crossover: When MACD crosses below the signal line → potential downward momentum.
-
Zero Line Cross: When MACD moves above zero → bullish trend confirmation; below zero → bearish trend.
Best Forecasting Tip:
Combine MACD crossovers with trend direction. For example, a bullish crossover while the price is above the 200-day moving average gives a strong confirmation of trend continuation.
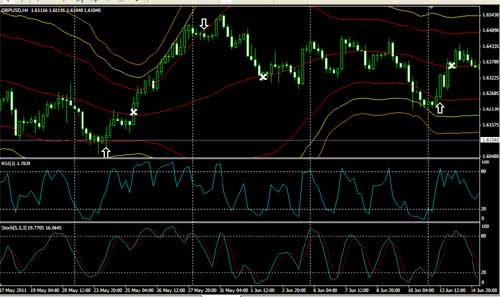
3. Understanding Bollinger Bands
What It Measures:
Bollinger Bands help traders identify volatility and potential price breakouts. They consist of:
-
A 20-day moving average (middle band)
-
A +2 standard deviation line (upper band)
-
A –2 standard deviation line (lower band)
How to Use Bollinger Bands for Forecasting:
-
Squeeze: When the bands narrow, it indicates low volatility and a likely upcoming breakout.
-
Expansion: Wide bands suggest high volatility — the market is already moving strongly.
-
Reversal Signals: Price touching the upper band in a range-bound market may suggest overbought conditions; touching the lower band may indicate oversold.
Example:
If EUR/USD prices are repeatedly bouncing off the lower band while RSI is rising from oversold, it signals a possible bullish reversal.
Combining RSI, MACD & Bollinger Bands for Stronger Forecasts
Using these indicators together provides more reliable signals:
| Indicator | Main Use | Best For Forecasting When… |
|---|---|---|
| RSI | Measures momentum strength | Confirms overbought/oversold levels |
| MACD | Measures trend momentum | Confirms trend reversals or continuation |
| Bollinger Bands | Measures volatility | Detects breakout and consolidation phases |
Example Forecasting Setup:
-
Step 1: RSI below 30 → possible oversold signal
-
Step 2: MACD bullish crossover → confirms trend reversal
-
Step 3: Price breaks above middle Bollinger Band → strong buy signal
This combination increases accuracy because each indicator confirms a different aspect of price behavior — momentum, trend, and volatility.
Common Mistakes to Avoid
-
Relying on one indicator alone
-
Ignoring higher timeframes (always check daily/weekly trends)
-
Using indicators without considering market context or news events
Pro Tip for 2025 Traders
With the help of AI-powered charting tools and real-time data analytics (like on TradingView or MetaTrader 5 mobile), traders can automate these indicators and receive instant alerts when the three align — saving time and increasing accuracy.
Final Thoughts
The RSI, MACD, and Bollinger Bands are three of the most powerful forecasting tools in technical analysis. When combined, they help traders filter false signals and identify high-probability setups.
Mastering their use is a key step toward building a consistent and data-driven trading strategy in 2025.